Sand Box: Search/Plot Earthquake Scenarios to Get Details and Conduct Ground Motion Analysis
The 2023 USGS seismicity model for faults in the western United States presents the regional seismicity through many earthquake scenarios that rupture multiple fault sections. This reflects decades of observations that large crustal earthquakes often rupture sections of different neighboring faults. The scenarios are optimally designed to collectively release the accumulating seismic moment rates on faults constrained by various geologic, geodetic, and seismologic data types.
The USGS model includes 553115 earthquake scenarios that rupture different combinations of sections of 1016 parent crustal faults. Five thousand five hundred seventy-two short subsections delineate the parent faults.
The Search/Plot Earthquake… link is designed for two purposes:
- Get more information on the scenarios and the participating faults and segmentation
- Estimate ground motion for the user-select scenario over a user-define line
The link opens a map of all regional parent faults, as shown in Figure 1, to allow users to select a site for scenario search. The user selects the lower magnitude threshold and the search radius for the search. There are two options for the search:
- Search to get details
- Search to select a scenario for ground motion analysis
The first option creates an output, as shown in Figure 2. It creates a table of the top 200 scenarios with the highest occurrence rates within the selected radius. The user can plot one or more scenarios to see their delineation and geometries. The user can click on a scenario trace to get more info on that scenario, the ruptured fault, and the segment, as shown in Figure 3.
The second option creates an output very similar to Figure 2. The user needs to select a scenario to conduct ground motion analysis; see Figure 4 for more detail. On the ground motion page, see Figure 5, the user can select the followings:
- The ground motion prediction equations GM analysis
- The shallow soil site conditions
- Types of the ground motions to calculate
- The site locations, defined along the line A-B in Figure 5
More information on the options and the parameters are given on each web page.
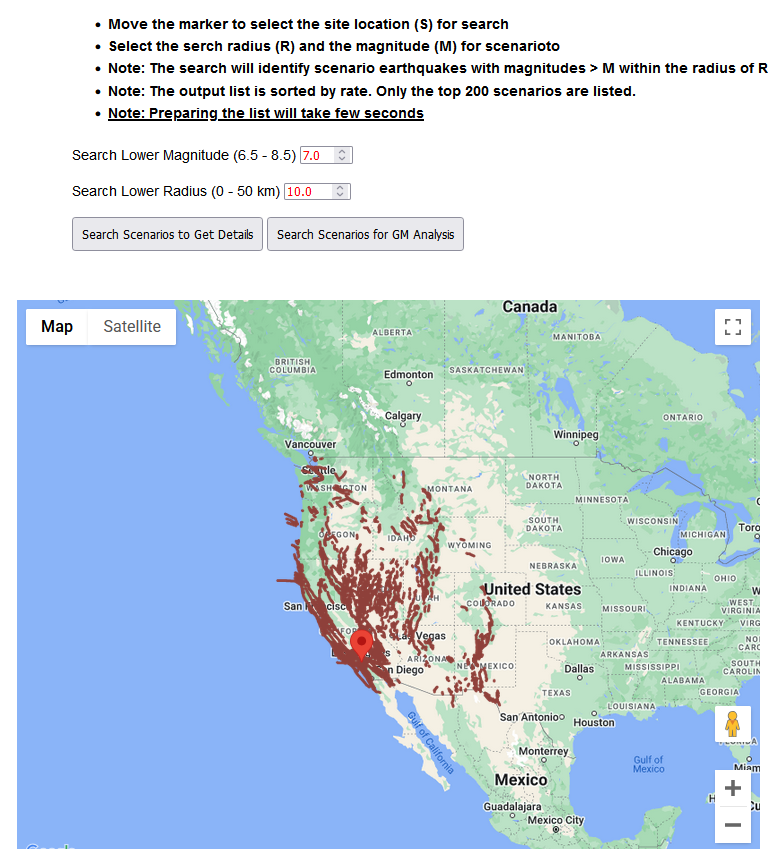
Figure 1. Move the marker to select the center of the search.
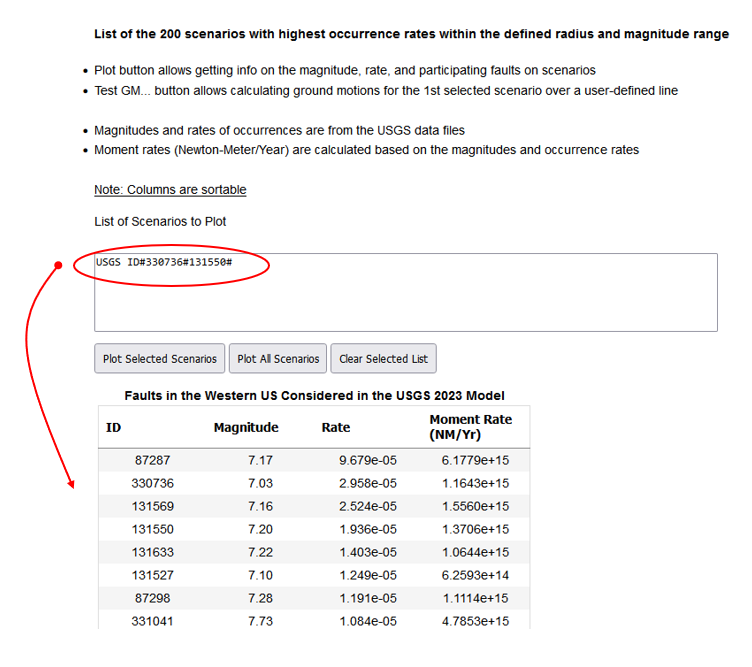
Figure 2. Click on the IDs on the table to select scenarios.
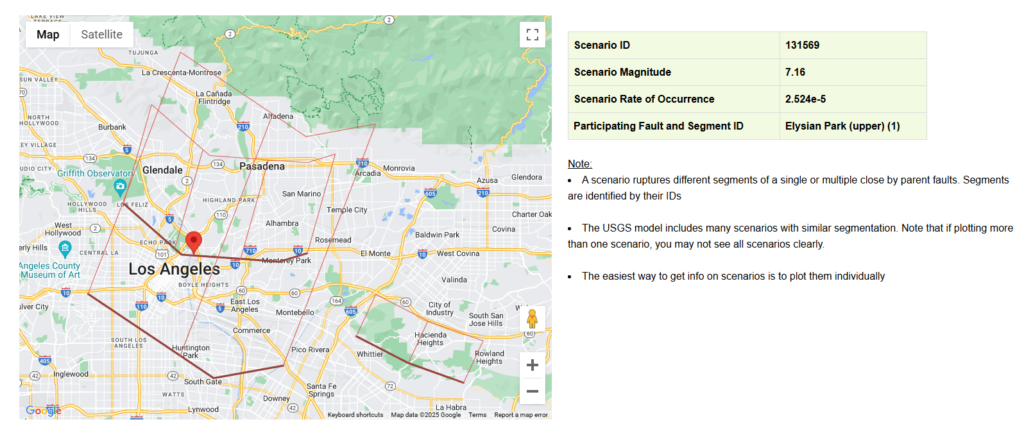
Figure 3. Click on a scenario trace to get info on the scenario, the ruptured fault, and the related segment.
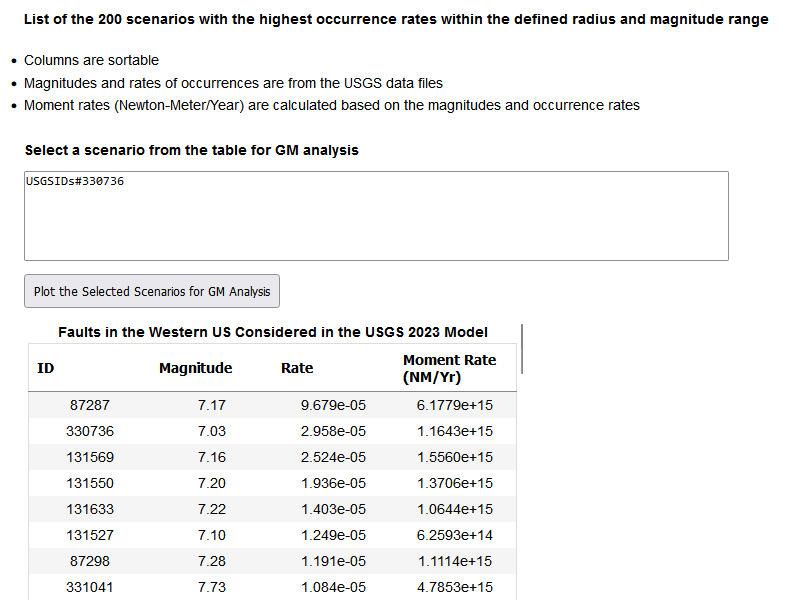
Figure 4. Click on an ID on the table to select a scenario for ground motion analysis.
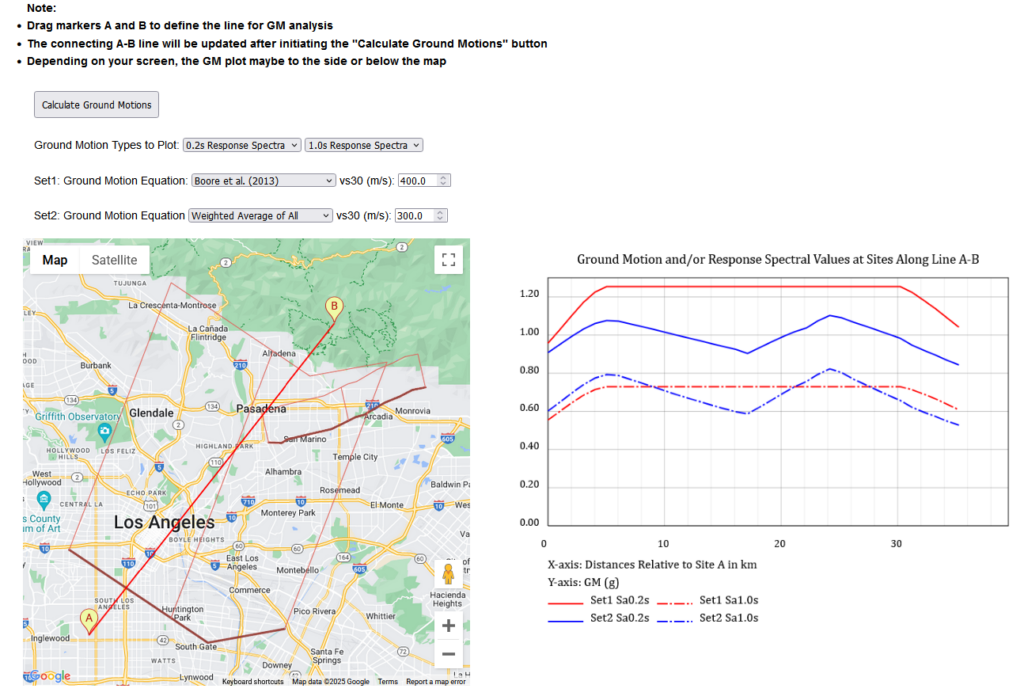
Figure 5. Move markers A and B to define the line for locating the sites. Select other parameters and click “Calculate Ground Motions” to calculate ground motions along lines A-B.