- Sand Box: Construct Faults Seismicity Models Using Slip Rate
- Gutenberg-Richter Magnitude-rate Distribution
- Characteristic Magnitude-Rate Distribution
Building a regional seismicity model is constructing a model for the occurrences of all potential regional earthquakes consistent with the available geologic, seismic, geodetic, instrumental and historic earthquake data at local and regional scales. The process, in a nutshell, consists of
- Identifying and delineating active and potentially active seismic sources which include
- Crustal faults
- Subduction zones in regions close to plate boundaries
- Areal seismic sources to capture seismicity of large areas with random sources, including background seismicity
- Constructing magnitude-rate distributions (MRDs) for all identified seismic sources using different available regional and local earthquake-related information to constrain the rates of occurrences of different magnitude earthquakes on different seismic sources
Building a realistic regional seismicity model is a very elaborate data and labor-intensive process. It requires decades of collecting and processing geologic data on crustal faults, historical and instrumental recording of regional earthquakes, and geodetic data, among other things. This information is used to formulate MRDs for the identified seismic sources so that the integrated regional seismicity model estimates consistent rates of seismicity for different magnitude earthquakes with what is inferred from the instrumental and historical earthquake and geologic and geodetic data.
The identification and delineation of seismic sources are beyond the scope of this website. The main focus here is to discuss the formulation of MRDs for single faults and/or subduction zones, allow users to build MRDs for virtual faults, and examine how different fault and MRD-related parameters impact the MRDs’ results.
There are different possibilities for building an MRD for a seismic source. The most common models used in practice are the Gutenberg-Richter (GR) and the characteristic-earthquake (ChE) models. Figure 1 shows plots of two typical magnitude-rate distributions for faults, subduction zones, or areal seismic sources. The red line shows a GR distribution where a single exponential distribution well captures the seismicity. The blue line shows a more complex scenario where combining a GR and a ChE model defines seismicity. See the links above for the details of these distributions.
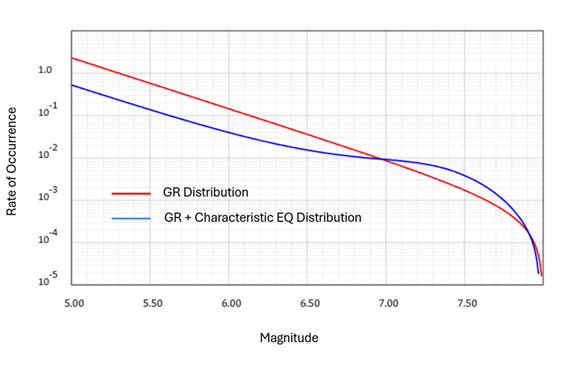
Figure 1.
The Sand Box is designed as an interactive tool to build seismicity models for user-defined fault or subduction zone scenarios using GR and ChE MRDs. Figure 2 shows an image of a typical page from the Sand Box link. The input parameters are the virtual fault dimensions, slip rates, and the basic parameters for the GR and ChE MRDs used for modeling. The module is designed to simulate MRDs for two virtual faults to let users examine and visualize the impacts of changing different parameters on the MRD results. The “Reset …” buttons reset the parameters of one set to the other. This makes it relatively easy to change the values of one parameter at a time for the virtual faults and examine the impact on the MRD results.
The table tabulates the implied return periods, calculated as \(1/Rate\), for earthquakes of different magnitudes ranges. Using a Poisson occurrence probability model, the table also tabulates the occurrence probabilities for the earthquakes in 30 years.
The input parameter “% Moment Release by CH EQ” defines the percentage of the accumulating seismic moment rate released by the characteristic earthquakes. It is important to mention that this parameter is poorly defined, and its function here is mainly for educational purposes. In practice, seismologists often construct seismicity models for a group of regional faults rather than a single fault in isolation. They use the best estimates of regional and/or local occurrence rates of small, moderate, and large earthquakes to constrain the MRD of faults. The details, choices, and possibilities depend upon the region’s history of earthquake recording and the availability of various earthquake-related data.
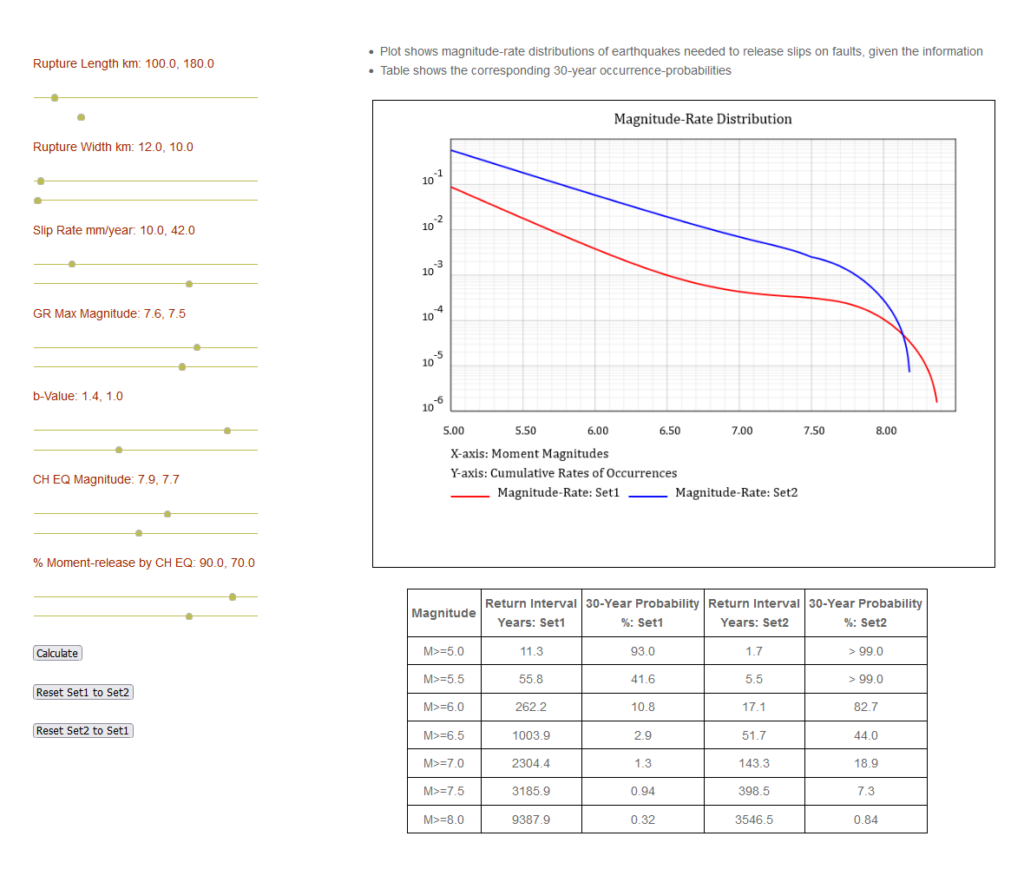
Figure 2.