- Sand Box: Hazard Analysis for Earthquakes on Virtual Faults
- Probabilistic Seismic Hazard Analysis: Technical Details
In regions where earthquakes are common, buildings are repeatedly exposed to ground motions (GMs) of varying intensity. These motions come from earthquakes on well‑mapped regional faults as well as from sources that may not yet be identified. Seismic hazard analysis (SHA) is the discipline devoted to estimating how often, i.e. the annual rate, a site or structure will experience GMs that exceed different specified levels. These annual frequencies are known as GM exceedance rates.
To understand why SHA is necessary, it helps to recognize the many uncertainties involved in future earthquakes. We cannot predict precisely when an earthquake will occur, where it will nucleate, how large it will be, or what ground motions it will generate. Because of these uncertainties, SHA aims to produce estimates that are as robust, unbiased, and scientifically defensible as possible. This is why modern SHA cannot rely solely on deterministic scenarios. Instead, it uses probabilistic models to explicitly represent uncertainty—a framework known as probabilistic seismic hazard analysis (PSHA).
A full regional PSHA is a substantial undertaking. It requires extensive data and analytical tools, and it must account for a wide range of geologic, tectonic, and seismologic factors. The purpose of this page, the accompanying link, and the interactive Sand Box is to help learners explore how these factors influence hazard estimates. By experimenting with different inputs, users can develop a deeper intuition for how PSHA works and why certain parameters matter.
The Sand Box —illustrated in Figure 1—allows users to construct two sets of characteristic earthquakes on virtual faults. It then computes the resulting GMs and exceedance probabilities at sites located along a line perpendicular to the fault traces. This setup enables users to investigate how fault geometry, characteristic magnitude, and recurrence interval, faulting mechanism, GM prediction equations, and shallow soil conditions affect both short‑ and long‑period response spectral values and their associated exceedance probabilities. By adjusting these parameters, learners can directly see how each parameter shapes the hazard at user‑defined sites crossing the fault.
Below is a sample page from the Sand Box . The links at the top provide additional technical explanations of GM simulation and probabilistic hazard analysis, allowing users to connect hands‑on exploration with the underlying scientific principles.
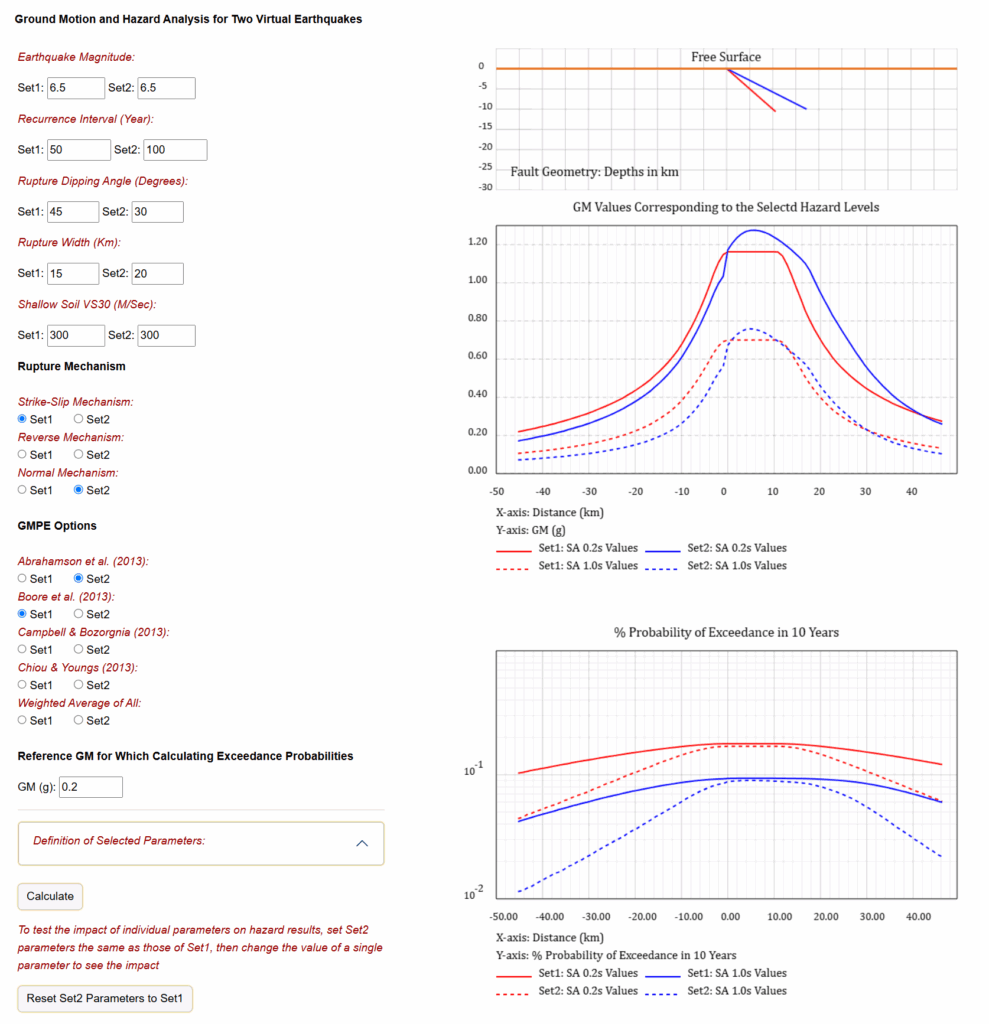
Figure 1.