Ground Motion Site Amplification: \(F_{site}(f)\). See Earthquake Ground Motion and Response Spectral Analysis:
The recordings of the ground motions (GMs) of many past earthquakes have shown that the shallow soil site conditions strongly impact GMs on the free surface experienced by structures. Sites underlain by soft soil materials can dramatically amplify GMs, especially when experiencing weak GMs. Under weak GMs, soil materials behave almost elastically with negligible damping of the propagating seismic energy. However, when experiencing strong GMs, soft soil materials vibrate under high strain levels, which tend to lower the soil’s effective shear wave velocity and increase the rate of seismic energy loss. Both these effects are frequency-dependent with rather complex overall effects on earthquakes’ GMs, often deamplifying the short-period and amplifying the long-period waves.
Figure 1 shows the average effects of two shallow soil conditions on short and long periods, i.e. 0.2s and 1.0s, GM response spectra based on the four GM prediction equations (GMPEs) used by the USGS for the 2023 earthquake hazard analysis of the western US. The response spectral values are calculated for an M7 earthquake with a vertical rupture area. Red and blue lines show the results for soft and stiff soil conditions, respectively. Close to the rupture area, sites experience strong GMs and vibrate under high strain levels. The sites with soft soil conditions deamplify high-frequency response spectral values compared with those with stiff soil conditions. Far from the rupture area, sites experience weak GMs and vibrate under low strain levels with low damping of the propagating seismic waves. This results in higher response spectral values at the sites with soft soil materials than those with stiff soil materials for both low and high-frequency response spectral values.
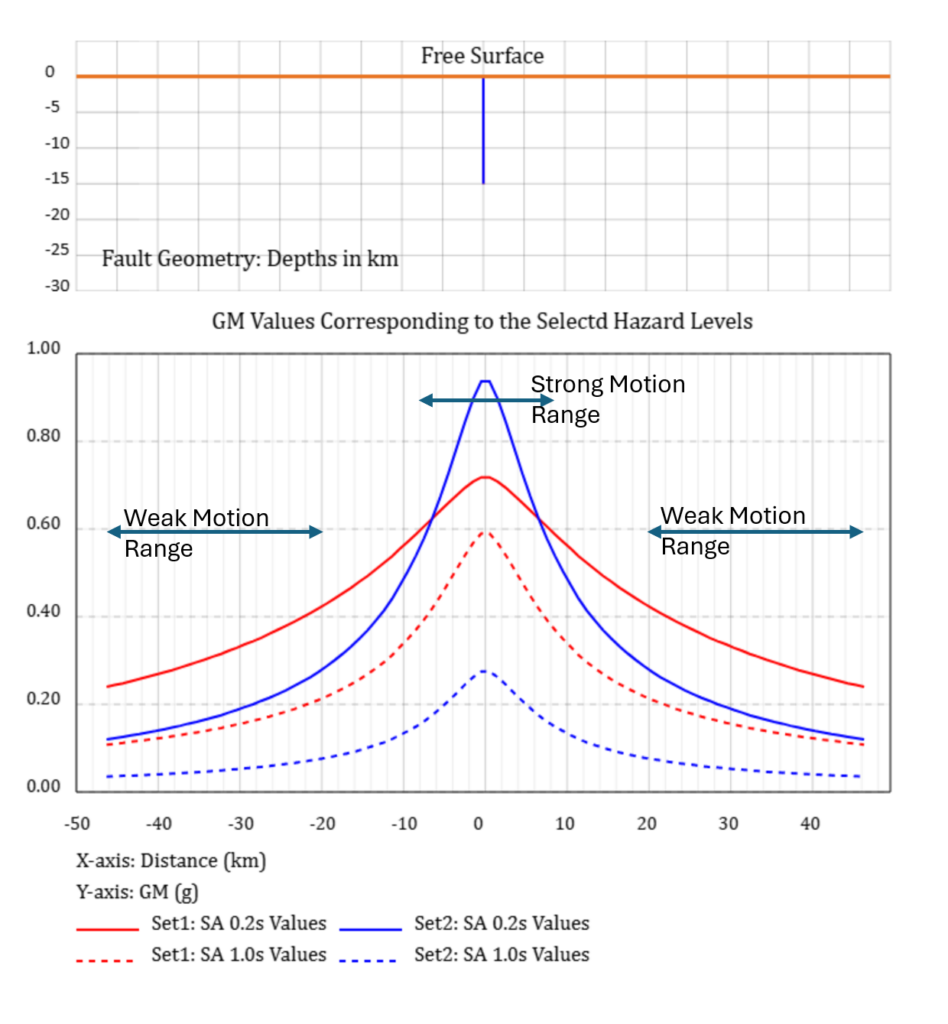
Figure 1.
Characterizing site conditions for earthquake response analysis is difficult and time-consuming. Traditionally and for practical reasons, shallow soil site conditions are characterized by the average shear wave velocity within the top 30 meters, often referred to as \(V_{30}\). The reason for using 30 meters depth to represent soil site conditions is that geotechnical engineers have historically used 30m boreholes to obtain various information on the shallow soil conditions at construction sites, which often are used to characterize site conditions empirically.
Due to their unique conditions, some sites may strongly amplify GMs of specific frequencies. This often happens when a site is underlain by soft soil materials sitting on top of stiff soil or a bedrock layer. The reverberation of seismic waves within the soft shallow layer, see Figure 2, can amplify seismic waves of certain frequencies. Such sites are often identified by their natural periods of vibrations, estimated in terms of the \(V_{30}\) and depth of the soft soil layer. For this purpose, the site condition is modeled by a single soil layer on top of a stiff or rock layer. The dominant wave frequencies that would experience amplification are estimated as follows:
$$f=\frac{(1+2n)V_{30}}{4H} …(1)$$
where \(n=0, 1, 2, …\) represents different harmonics, i.e. \(f_0=\frac{V_{30}}{4H}\), \(f_1=\frac{3V_{30}}{4H}\), \(f_2=\frac{5V_{30}}{4H}\)… Obviously, due to the high damping of high-frequency seismic waves by soft soil materials, the amplifications of the harmonics are rather modest or negligible. Most sites often exhibit more complex responses, which require elaborate modeling to reflect the site-specific soil layering details.
Not all sites are underlain by soft and stiff layers, as was described. The overall shear wave velocities for some sites may decrease from high values at depth to some lower values near the surface. A simple model of seismic energy flow through a ray tube requiring conservation of energy provides a simple model for the wave amplification for such cases as
$$\frac{u_s}{u_d}=\sqrt{\frac{\rho_dV_d}{\rho_sV_s}}…(2)$$
where \(u_s, V_s, \rho_s\) are the amplitude and velocity of seismic waves and the density of the materials, respectively, at the surface, and \(u_d, V_d, \rho_d\) are the amplitude and velocity of seismic waves and the density of the materials, respectively at depth.
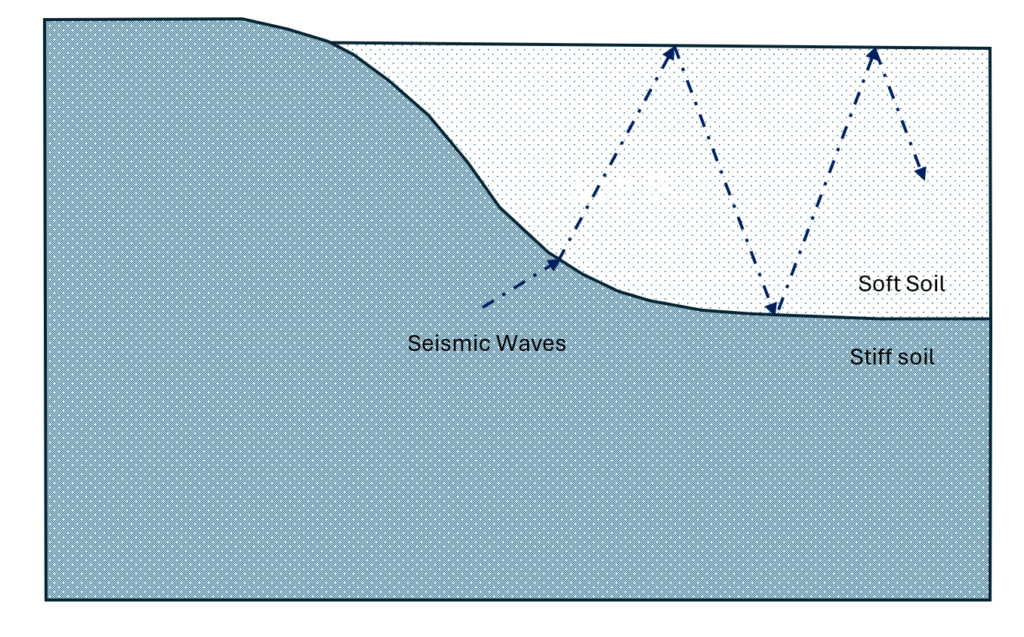
Figure 2.