Response Spectra: \(F_{bld}(f,T)\). See Earthquake Ground Motion and Response Spectral Analysis:
Earthquakes ground motions (GMs) at ground level are recorded as ground acceleration, velocity, and/or displacement. The responses of structures to earthquakes GMs differ from the ground motions experienced at the ground level. The intensity and the frequency content of the vibration of a simple structure with a single degree of freedom (SDF) primarily depend on what is known as the natural frequency of the vibration and its dynamic damping state. For practical reasons, engineers often use response spectral values to evaluate the responses of structures to earthquake ground motions, see Figure 1.
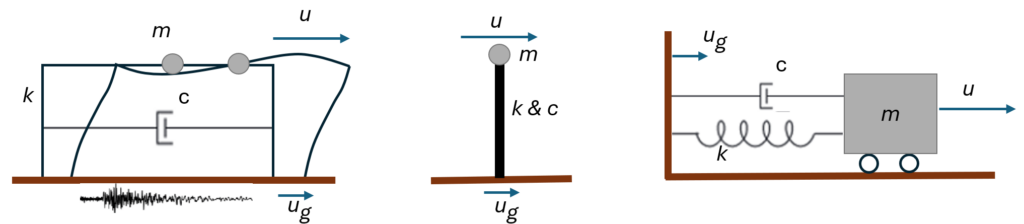
Figure 1. A simple representation of a structure with a single degree of freedom with the mass, stiffness, and damping of \(m\), \(k\), and \(c\), respectively. The equation of motion of such a system can be written as
$$m\ddot{u}+c\dot{u}+ku=-m\ddot{u_g}…(1)$$
For a simple structure, represented by a mass and a damper with a single degree of freedom, the response spectra are defined as the maximum displacement, velocity, and acceleration the mass experiences in response to an earthquake ground motion, formulated by the Duhamel integral.
$$S_d=[u(t)]_{max}=\frac{\int{\ddot{u_g}e^{-\xi\omega(t-\tau)}}sin[\omega_d(t-\tau)]d\tau}{\omega}…(2)$$
where \(\omega\) is the undamped natural frequency, \(\omega_d=\omega \sqrt{1-\xi ^2}\) is the damped natural frequency, and \(\xi\) is the damping ratio.
For practical reasons, it is often necessary to create response spectral plots for simple structures with different natural periods of vibrations and damping ratios. Engineers also use the concept of pseudo response spectra, which estimates velocity and acceleration response spectral values based on the displacement response spectra as \(S_v=S_d*\omega\) and \(S_a=S_d*\omega^2\), respectively, where \(S_d\) is the displacement response spectra and \(\omega\) is the structure natural frequency.
Figures 2, 3, and 4 show plots of time histories, free-surface spectral response, and SDF response spectra for two earthquakes of the same magnitudes but with different strop drops and propagating path conditions. The primary purpose of presenting these figures is to demonstrate the difference between the free surface and building responses to earthquake ground motions. It should be noted that the horizontal access in Figure 2 represents the frequencies of seismic waves. In contrast, the horizontal access in Figure 3 represents SDF buildings’ natural periods of vibration.
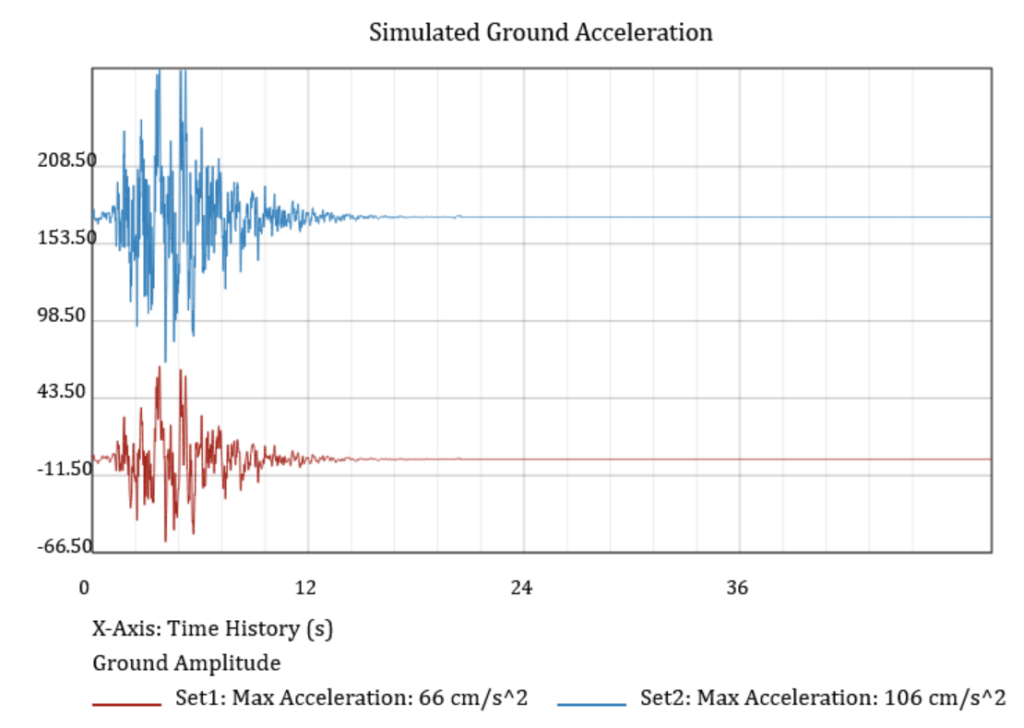
Figure 2. Simulated ground motion time histories of two earthquakes with the same magnitudes but with different strop drops and propagating path conditions
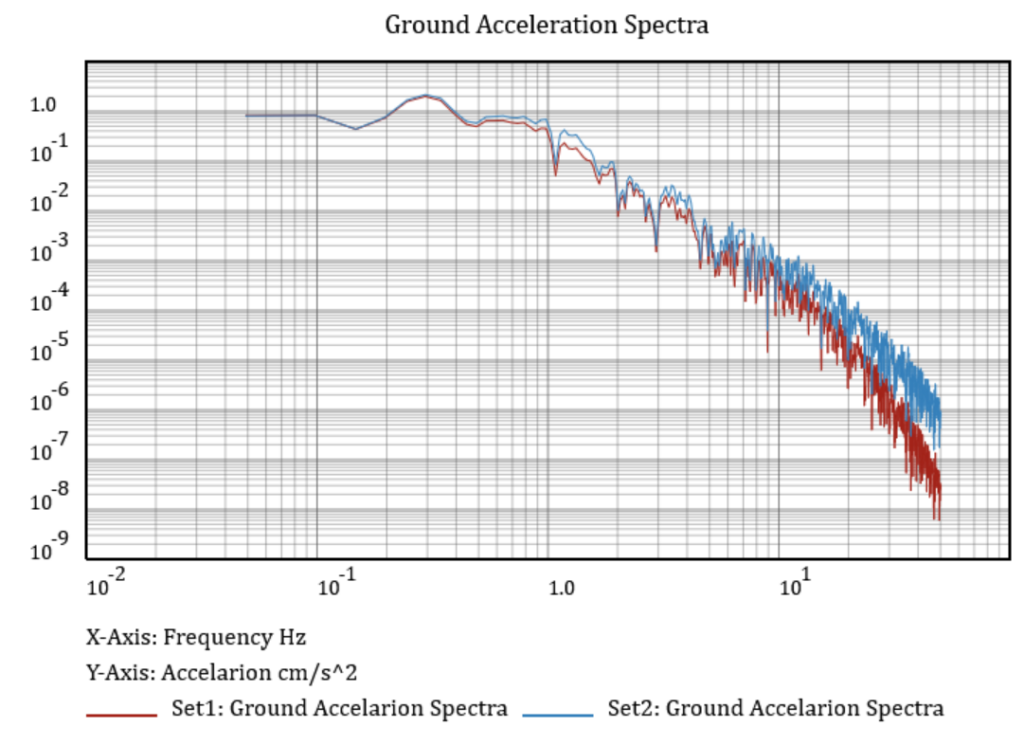
Figure 3. Free surface spectral values
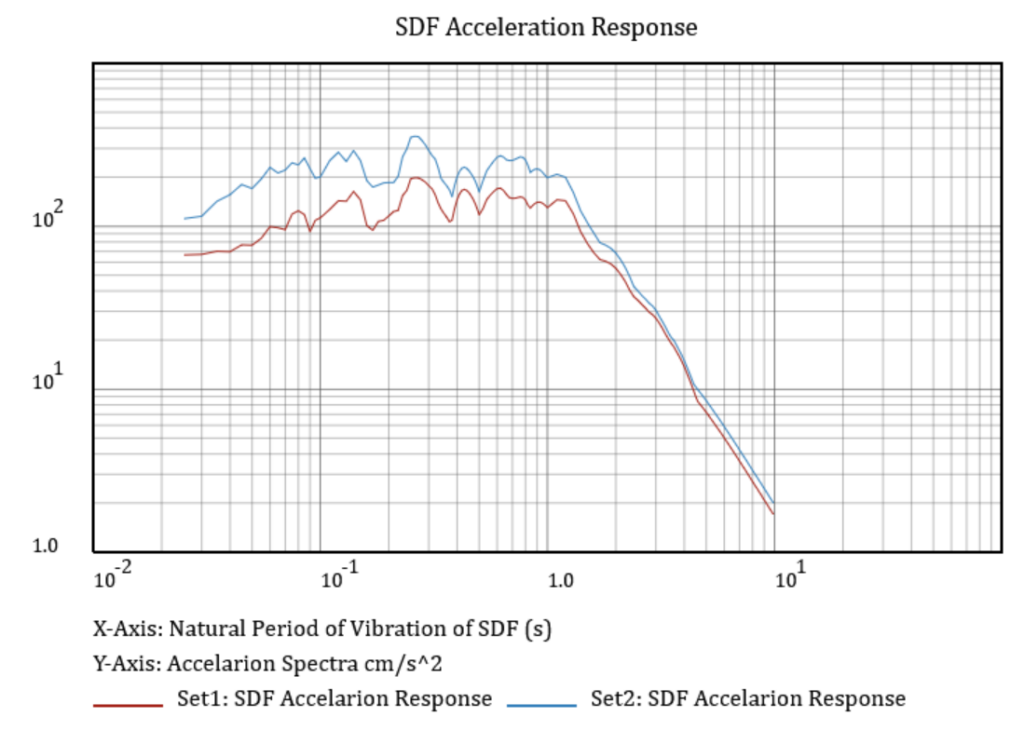
Figure 4. SDF response spectra