Sand Box: Ground Motion & Response Spectral Analysis
Many cities around the world are exposed to earthquake hazards. It is necessary to quantify earthquake hazards at sites of interest for engineering design, mitigation, and planning purposes. This requires reliable estimates of ground motions (GMs) and response spectra. During the last few decades, seismologists have developed several physical and empirical models for this purpose. Most recent models used in practice are empirical, known as ground motion prediction equations (GMPEs), based on the ground motion recordings of past earthquakes. The GMPEs and their components are mainly formulated based on seismologists’ understanding of the earthquake rupture process, seismic wave propagation within the crust and shallow soil layers, and the building responses to earthquake GMs, among other things.
Most recent GMPEs are complex. Because of that and their empirical nature, it is rather difficult for ordinary users to appreciate the sensitivity of GM estimates using GMPE models to various source, path, and local site conditions. Understanding the physical basis of GM formulation would help understand the complexity of the GMPEs. This page provides basic information on earthquake GMs’ physical formulation. The Sand Box module is designed to simulate earthquake GMs using this formulation to allow users to examine the impacts of various components on earthquake GMs and response spectra.

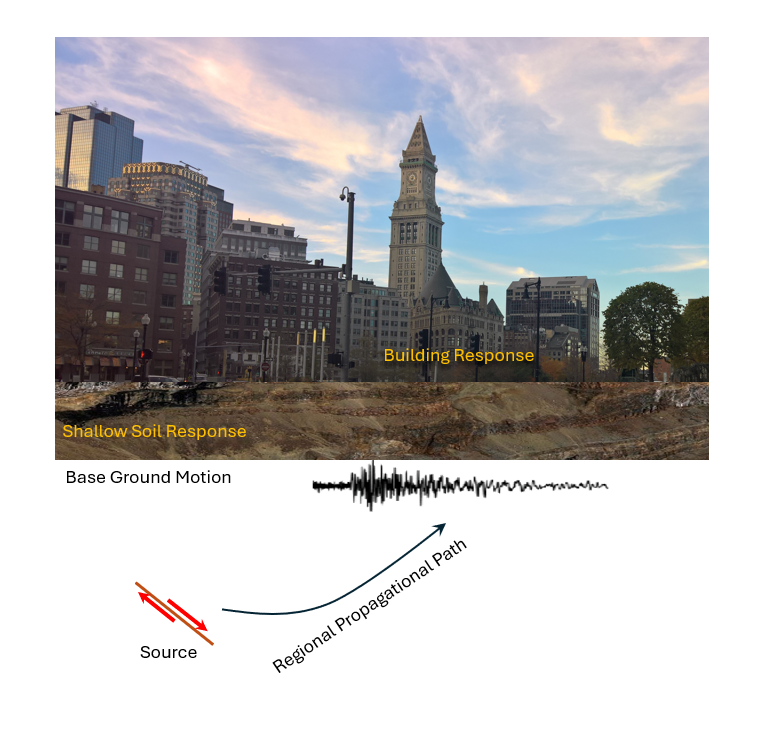
Figure 1. Buildings responses to earthquake ground motions are shaped by the details of the earthquake rupture process at the source, the impacts of regional and local material and seismic properties on seismic wave propagation, and the dynamic behavior of buildings that are often simplified by their natural frequencies of vibration and internal damping properties.
An earthquake ground motion in its simplest form can be formulated as
$$Y_g=F_{src}(M_0,f)*F_{geo}(R)*F_{attn}(R,f)*F_{frq}(f)*F_{site}(f)…(1)$$
- \(Y_g\): Ground acceleration, velocity, or displacement
- \(F_{src}(M_0,f)\): The source radiation function that is frequency dependent function and is scaled by seismic moment \(M_0\)
- \(F_{geo}(R)\): A distance-dependent function that captures the impacts of geometrical spreading of seismic waves through the region on ground motions
- \(F_{attn}(R,f)\): A distance and frequency-dependent function that captures the impacts of regional inelastic attenuation properties on ground motions
- \(F_{\kappa}(f)\): A frequency-dependent function that captures the observed fast decay of high-frequency ground motions. This term is often attributed to the near-site crustal effects.
- \(F_{site}(f)\): A frequency and GM intensity dependent function that captures the impacts of local shallow soil conditions on ground motions
A building response to an earthquake ground motion is formulated as response spectra.
$$Y_b=Y_g*F_{bld}(f,T)…(2)$$
- \(F_{bld}(f,T)\): A frequency and building dependent function. For response spectral analysis, a building is represented by its natural period of vibration \(T\).

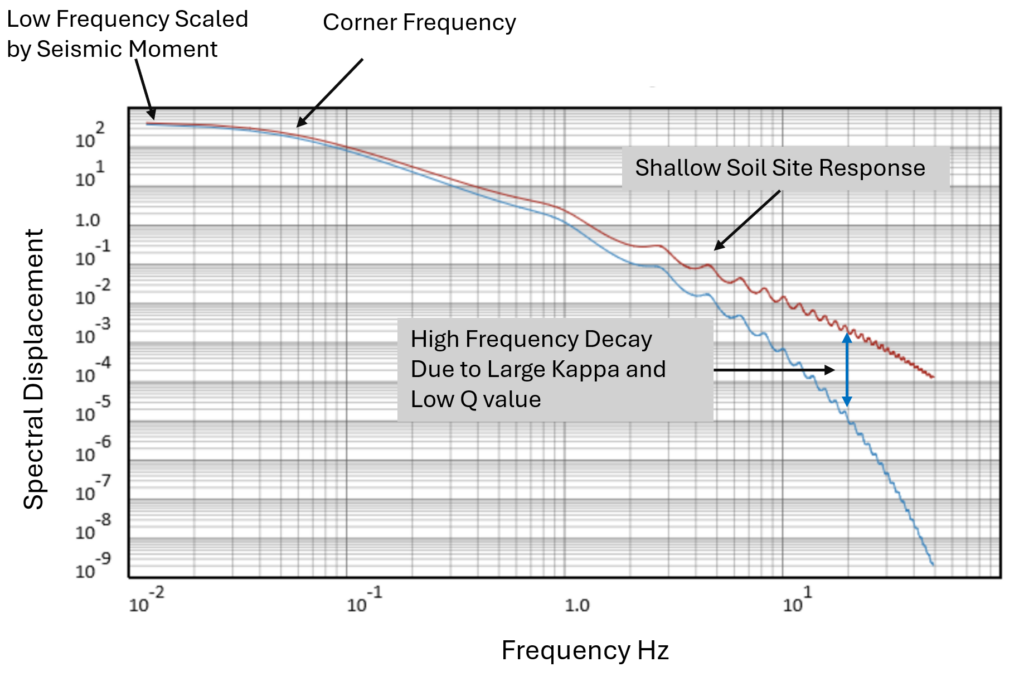
Figure 2. The plot of two typical spectral displacements at the free-surface ground. The spectral displacement at very low frequencies, i.e., long periods, saturates and reflects earthquake seismic moment. The corner frequency is a source-related parameter beyond which spectral displacement decays with frequency. Corner frequency decreases with increasing seismic moment and increases with increasing stress drop. The plot also shows the impacts of regional and shallow site conditions on spectral displacements. Seismic waves decay faster when propagating in regions with low quality-factor \(Q\) and high \(\kappa\), see \(F_{attn}(R,f)\), compared with those propagating in regions with high \(Q\) and low \(\kappa\) values. The Sand Box examines the impacts of these different source, path, and site conditions on GMs and response spectra.

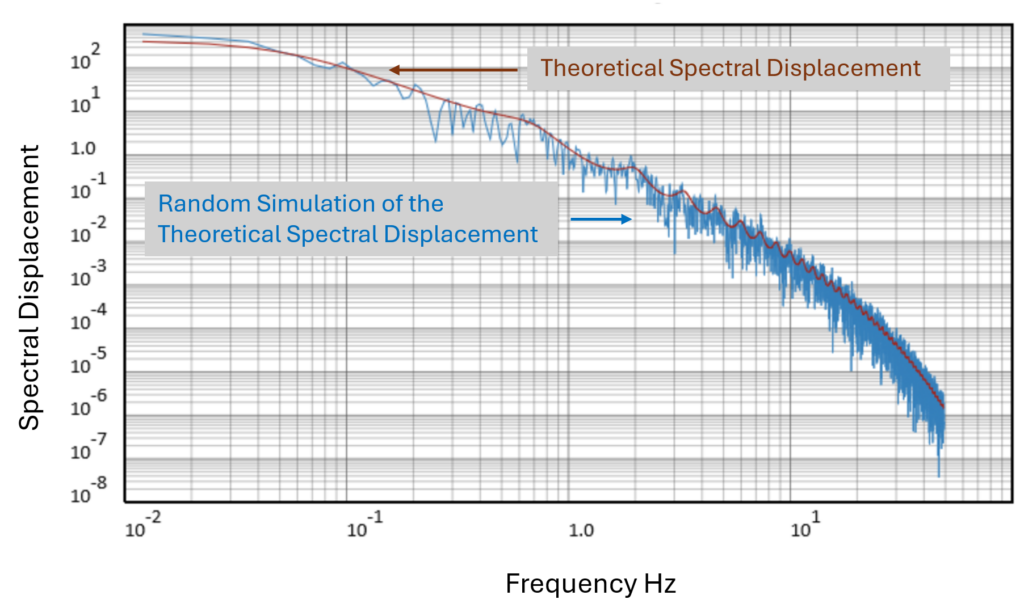
Figure 3. Plots of theoretical and simulated spectral displacements. The ground motions in the Sand Box module are simulated using random time histories shaped in the frequency domain by the source, path, and site conditions. Users can select a single random set for all simulations or randomize the time histories in each simulation. The latter case results in variation in simulated ground motion time histories and response spectral values in each simulation without changing any parameter.