Sand Box: Search/Plot Faults in Western US to Get Details
The USGS 2023 Seismicity Model for the western United States is built from an exceptionally large dataset: 553,115 earthquake scenarios. These scenarios represent the expected seismic behavior of 1,016 regional crustal faults, referred to in the USGS report as parent faults (see Figure 1). Many of the scenarios involve ruptures that span multiple fault sections, reflecting decades of observations showing that large crustal earthquakes often jump across adjacent fault segments. The scenarios are constructed so that, taken together, they release the long‑term seismic moment accumulation on faults, as constrained by geologic, geodetic, and seismologic data.
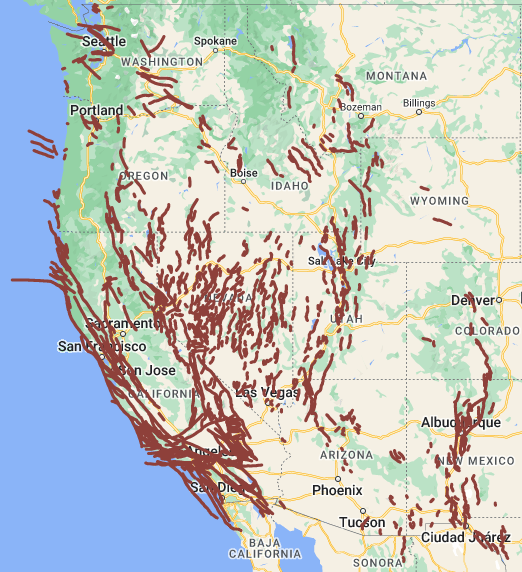
Figure 1. The delineation of the parent faults used in the USGS seismicity model
Earthquake Scenario Information
Each earthquake scenario in the USGS model is defined by:
- Magnitude
- Fault geometry
- Rate of occurrence
- Rupture mechanism
However, the USGS does not directly provide slip rates or moment-release rates for the parent faults themselves. This page and the accompanying link are designed to help users interpret the available information and understand what the model implies about fault behavior.
Learning Objectives
This module is intended to help users:
- Understand the rupture complexity of the parent faults used in the USGS seismicity model.
- Explore the earthquake potential of these faults using the USGS‑released scenario data.
Interactive Fault Search Tool
The Search/Plot Faults in Western US to Get Details link opens the interface shown in Figure 2. Users can specify:
- A center location, and
- A search radius
When the search radius button is activated, the module identifies all parent faults within the selected distance (Figure 3). The resulting table summarizes information derived from all USGS earthquake scenarios that rupture any segment of those parent faults.
Users may then select one or more parent faults (Figure 4) to view additional details.
Important Notes on Derived Fault Parameters
Because the USGS does not directly provide characteristic magnitude, moment rate, or slip rate for parent faults, these quantities are estimated using the scenario data:
- Seismic moment rate
Calculated as the sum of the seismic moment contributions from all scenario earthquakes that rupture any part of the parent fault. - Slip rate
Estimated by dividing the seismic moment rate by the rupture area of the parent fault. - Characteristic magnitude
Estimated from the rupture length and width of the parent fault. This represents the approximate magnitude the fault would generate if it ruptured on its own.
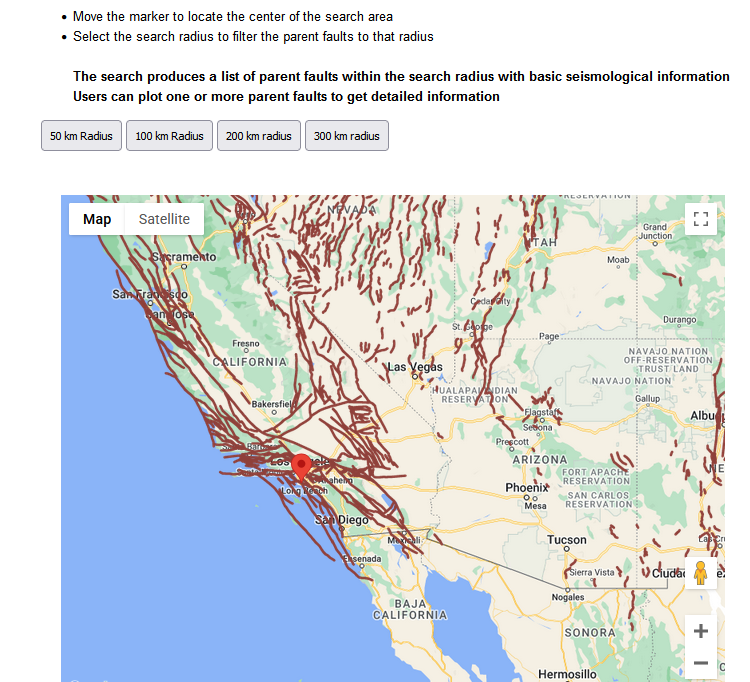
Figure 2. Users can select the center and the radius of the search
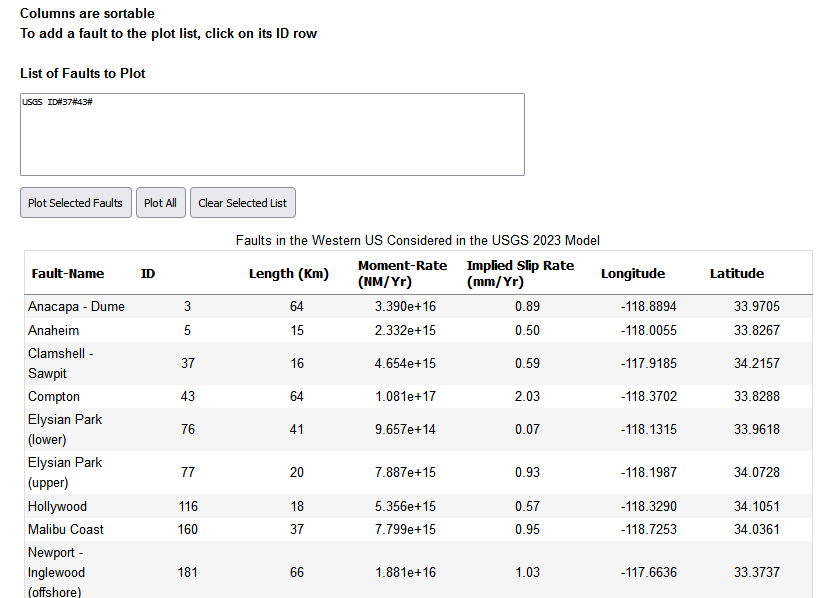
Figure 3. List of parent faults within the search radius. Results are based on integrating information from the earthquake scenarios in the USGS database.
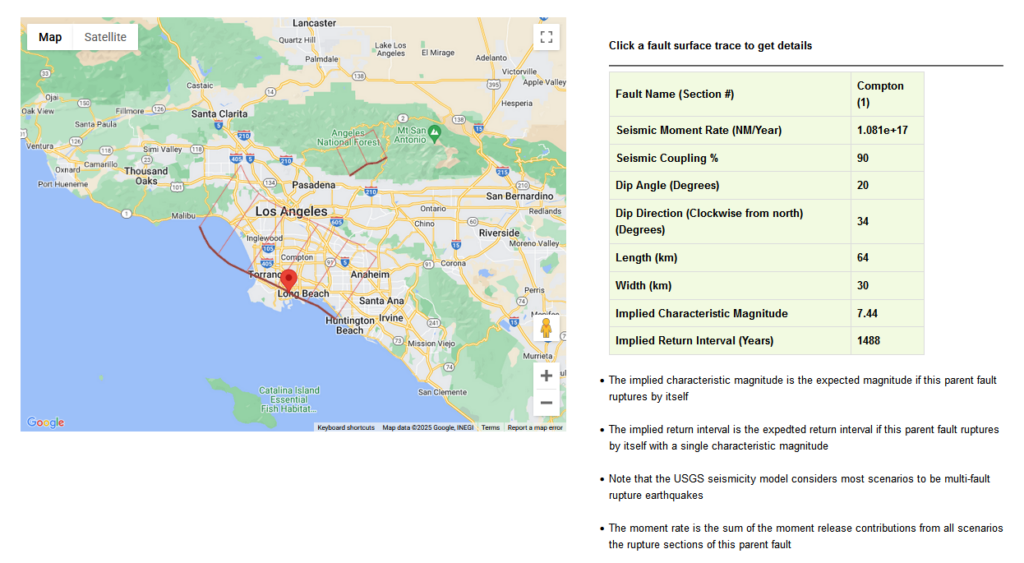
Figure 4. Users can click on a fault segment trace to get info on the segment ID and, fault geometry, and earthquake potential