- Sand Box: Construct Faults Seismicity Models Using Slip Rate
- Sand Box: Construct Regional Seismicity Models Using Geodetic Data
- Technical Details: Gutenberg-Richter Magnitude-rate Distribution
- Technical Details: Characteristic Magnitude-Rate Distribution
- Technical Details: Constructing Regional Seismicity Using Geodetic Data
Constructing a regional seismicity model means creating a framework that represents the occurrence of all potential earthquakes in a given region. This model must align with the full spectrum of available evidence—geologic, seismic, geodetic, instrumental, and historical—at both local and regional scales.
In essence, the process involves:
- Identifying and delineating seismic sources, which may include:
- Crustal faults
- Subduction zones near plate boundaries
- Areal seismic sources that capture broad, distributed seismicity, including background seismicity
- Constructing magnitude-rate distributions (MRDs) for each identified source. These MRDs are built using regional and local earthquake data to constrain how often earthquakes of different magnitudes occur on different sources.
Why It’s So Demanding
Developing a realistic seismicity model is not a quick task—it’s a long, data-heavy endeavor. Decades of work go into collecting and processing:
- Geologic data on crustal faults
- Historical and instrumental earthquake records
- Geodetic measurements
All of this information feeds into MRDs, ensuring that the integrated model produces earthquake occurrence rates consistent with what is observed in both the instrumental record and the historical and geologic evidence.
Scope of This Site
While the identification and mapping of seismic sources is beyond the scope of this website, the focus here is on formulating MRDs:
- Exploring MRDs for single faults and subduction zones
- Allowing users to experiment with MRDs for virtual faults
- Examining how different parameters influence MRD outcomes
MRD Models in Practice
There are several approaches to building MRDs, but two dominate in practice:
- Gutenberg-Richter (GR) model – A single exponential distribution that elegantly captures seismicity across magnitudes.
- Characteristic-earthquake (ChE) model – A model that highlights specific magnitudes as more likely, often used in combination with GR.
Figure 1 illustrates these two approaches:
- The red line shows a GR distribution, where seismicity follows a smooth exponential curve.
- The blue line shows a hybrid GR + ChE distribution, representing a more complex scenario.
For details on these models, see the linked resources above.
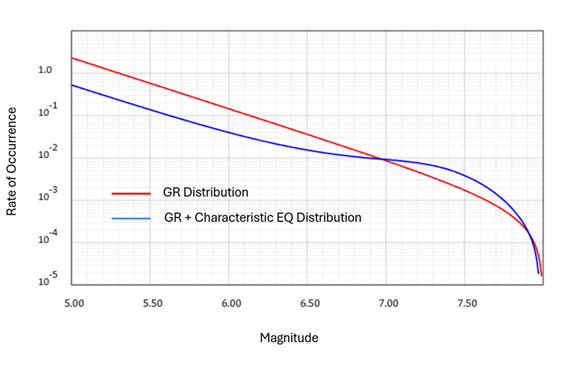
Figure 1.
The Sand Box: An Interactive Seismicity Modeling Tool
The Sand Box is designed as a hands-on environment where users can build seismicity models for custom fault or subduction zone scenarios. It uses Gutenberg-Richter (GR) and Characteristic-earthquake (ChE) magnitude-rate distributions (MRDs) as the foundation.
Figure 2 illustrates a typical Sand Box page. Users provide input parameters such as:
- Virtual fault dimensions
- Slip rates
- Core parameters for GR and ChE MRDs
The module allows simulation of MRDs for two virtual faults, enabling side-by-side comparison. This setup makes it possible to visualize how altering parameters affects MRD outcomes.
Parameter Resetting
The “Reset …” buttons synchronize one set of parameters with the other. This feature simplifies experimentation, allowing users to adjust one variable at a time and immediately observe its impact on MRD results.
Using a Poisson occurrence probability model, the table also shows the likelihood of earthquakes occurring within a 30-year window.
Return Periods and Probabilities
A table displays the implied return periods for earthquakes across different magnitude ranges, calculated as:
$$Return Period = \frac{1}{Rate}$$
One input, “% Moment Release by CH EQ,” specifies the fraction of accumulated seismic moment rate released by characteristic earthquakes. While this parameter is not well-defined scientifically, it serves an educational purpose in the Sand Box, helping users explore how such assumptions influence MRDs.
In practice, seismologists rarely model a single fault in isolation. Instead, they construct seismicity models for groups of regional faults, using the best available estimates of occurrence rates for small, moderate, and large earthquakes. The choices and constraints depend heavily on:
- The region’s earthquake recording history
- Availability of geologic, seismic, and geodetic data
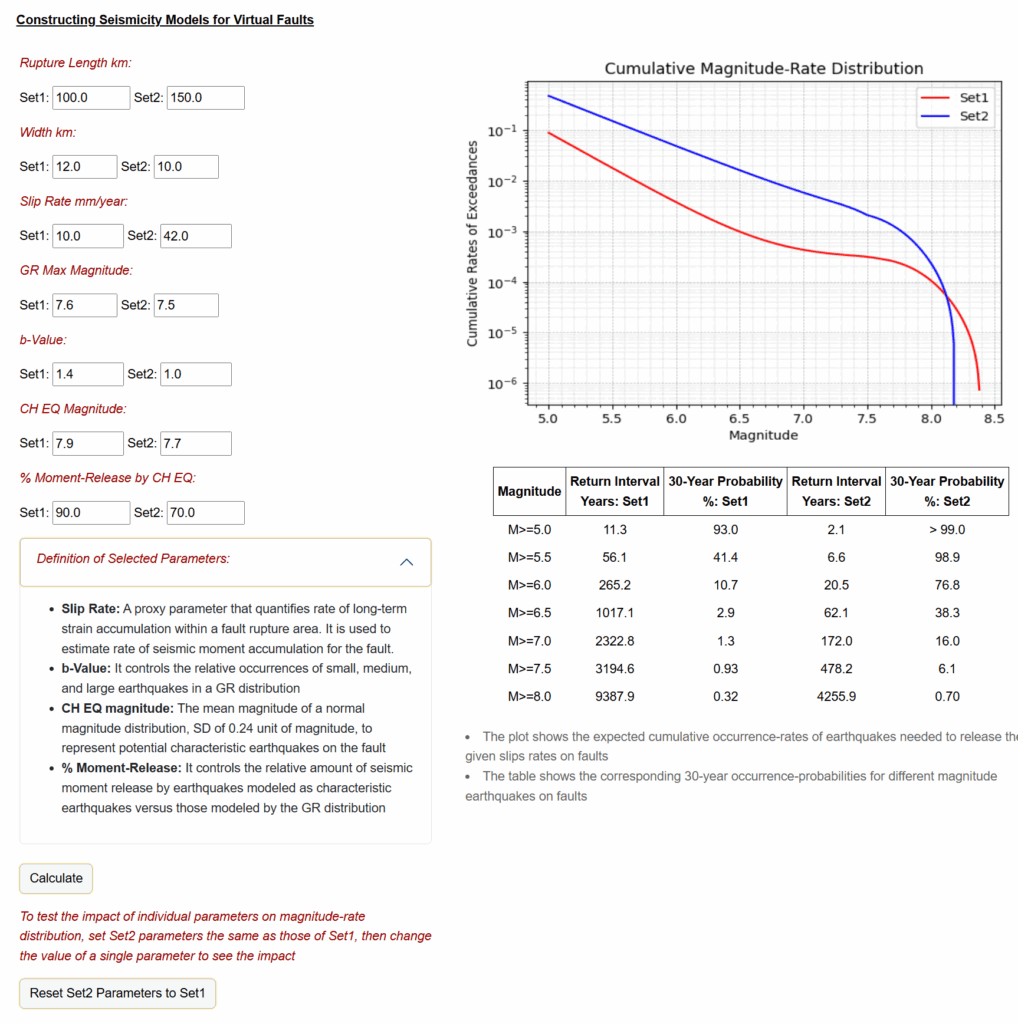
Figure 2.